Experiments between 2003 and 2009
Grape root borer experiments in Lancaster County, PA
A small number of grapes were grown on our farm until the early 1940’s. After that time one American hybrid vine was left that was probably planted about 1880 and still produces to this day. In 1974, the planting of French hybrid and vinifera grapes commenced on the farm. In 1981 the presence of grape root borer was confirmed in the portion of the vineyard that had been planted in 1976. 1 The vineyard is surrounded by cropland and the closest woodland that could harbor large quantities of native species of grapes is 1/3 of a mile away.
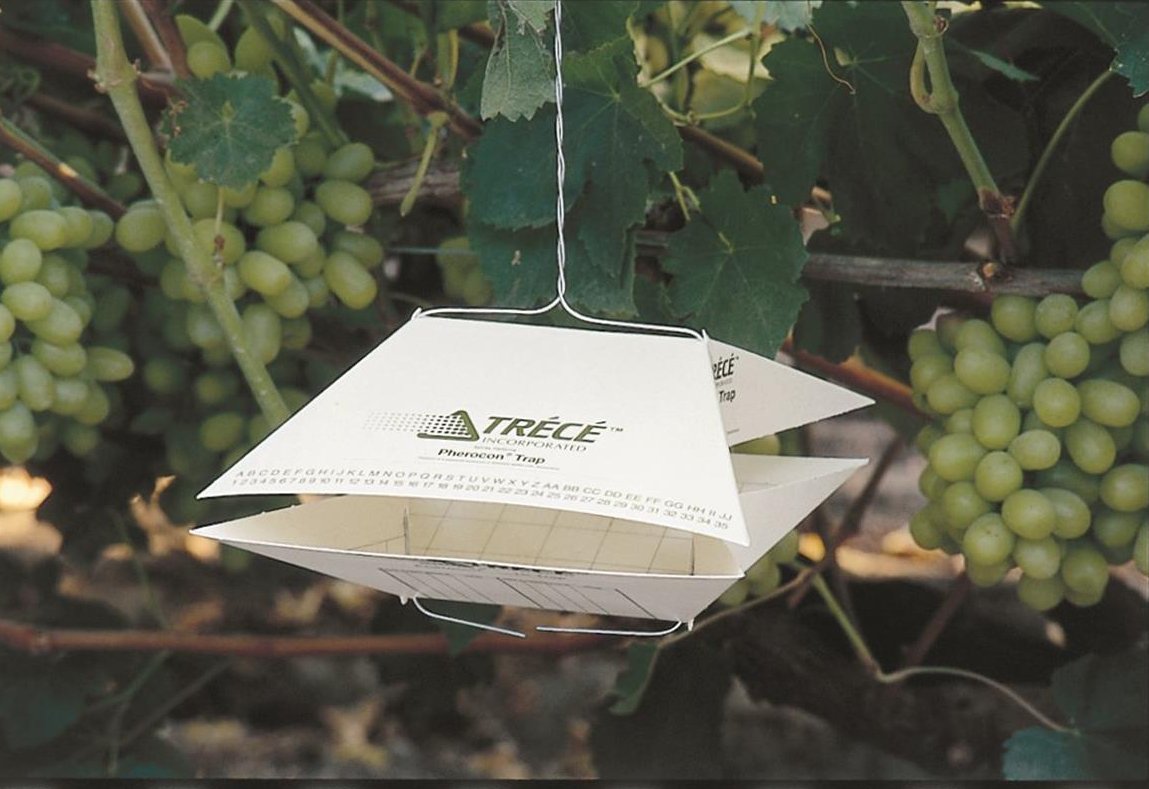
In 2001, one white paperboard wing trap with a pheromone lure was placed in the center of our vineyard. Adult male moths were observed landing on the sticky material coating the interior of the trap and then flying away. Large numbers of moths were seen in the vicinity of the trap but they would not enter. Additional moths were seen throughout the vineyard. During the summer, 78 moths were captured in the trap while an additional 112 moths were captured by hand or with a net for a total of 190 moths. The white paper wing trap was not very efficient in capturing adult male moths.
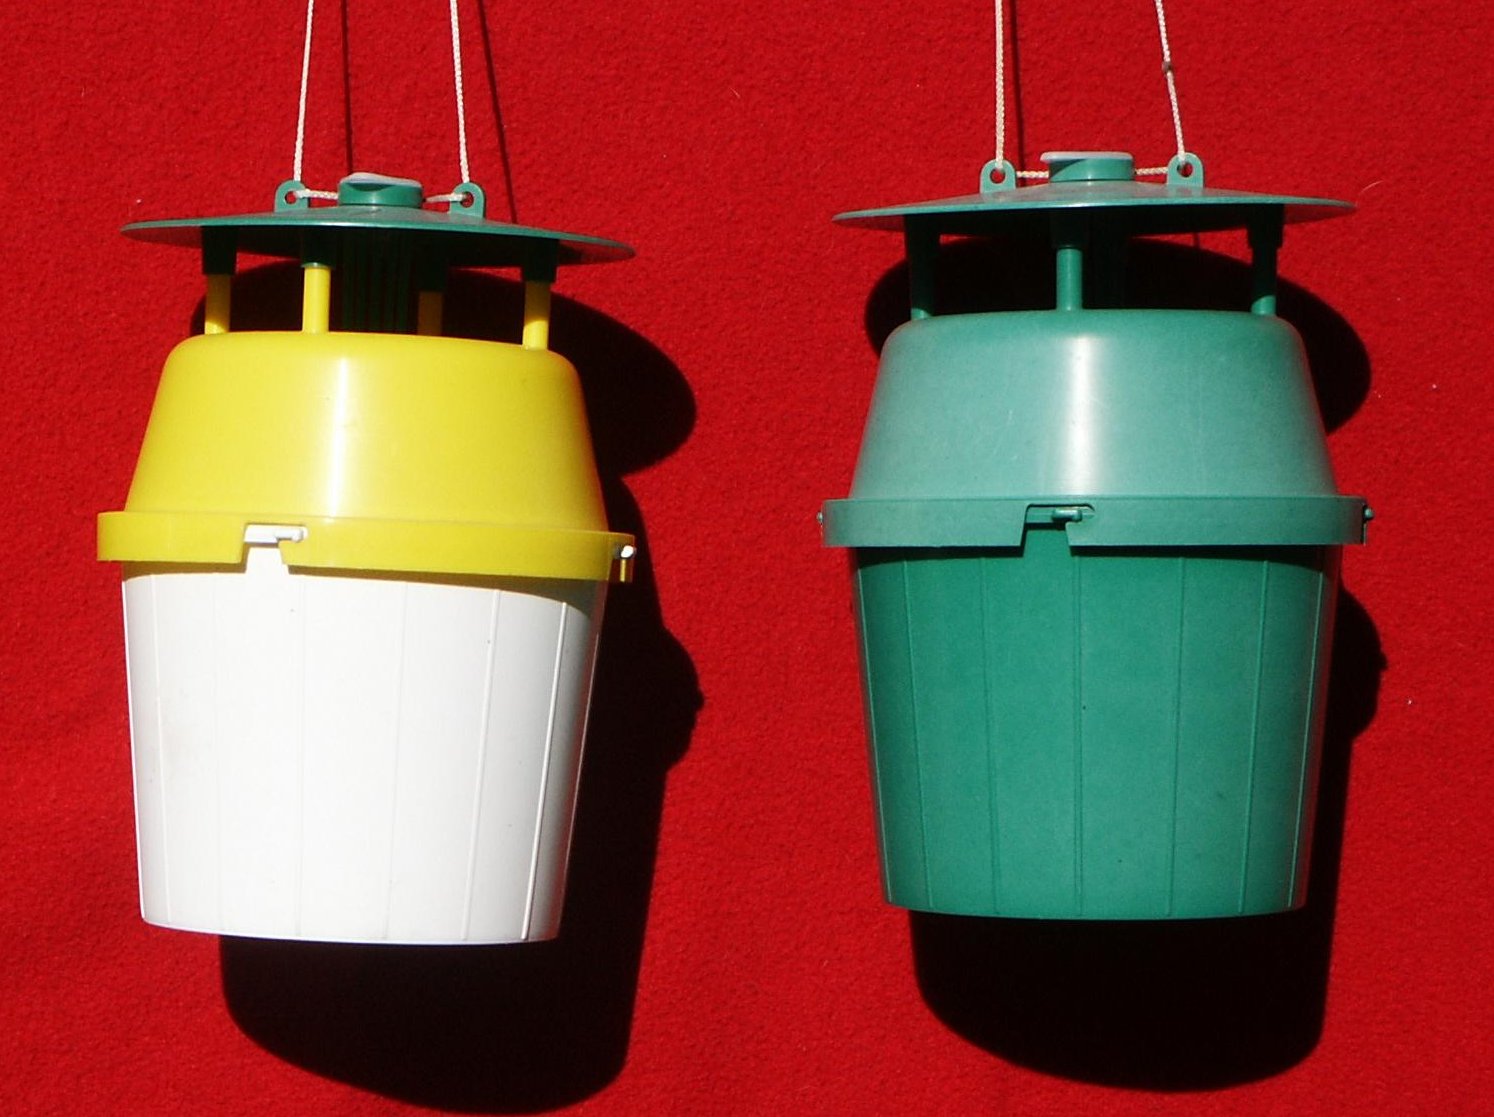
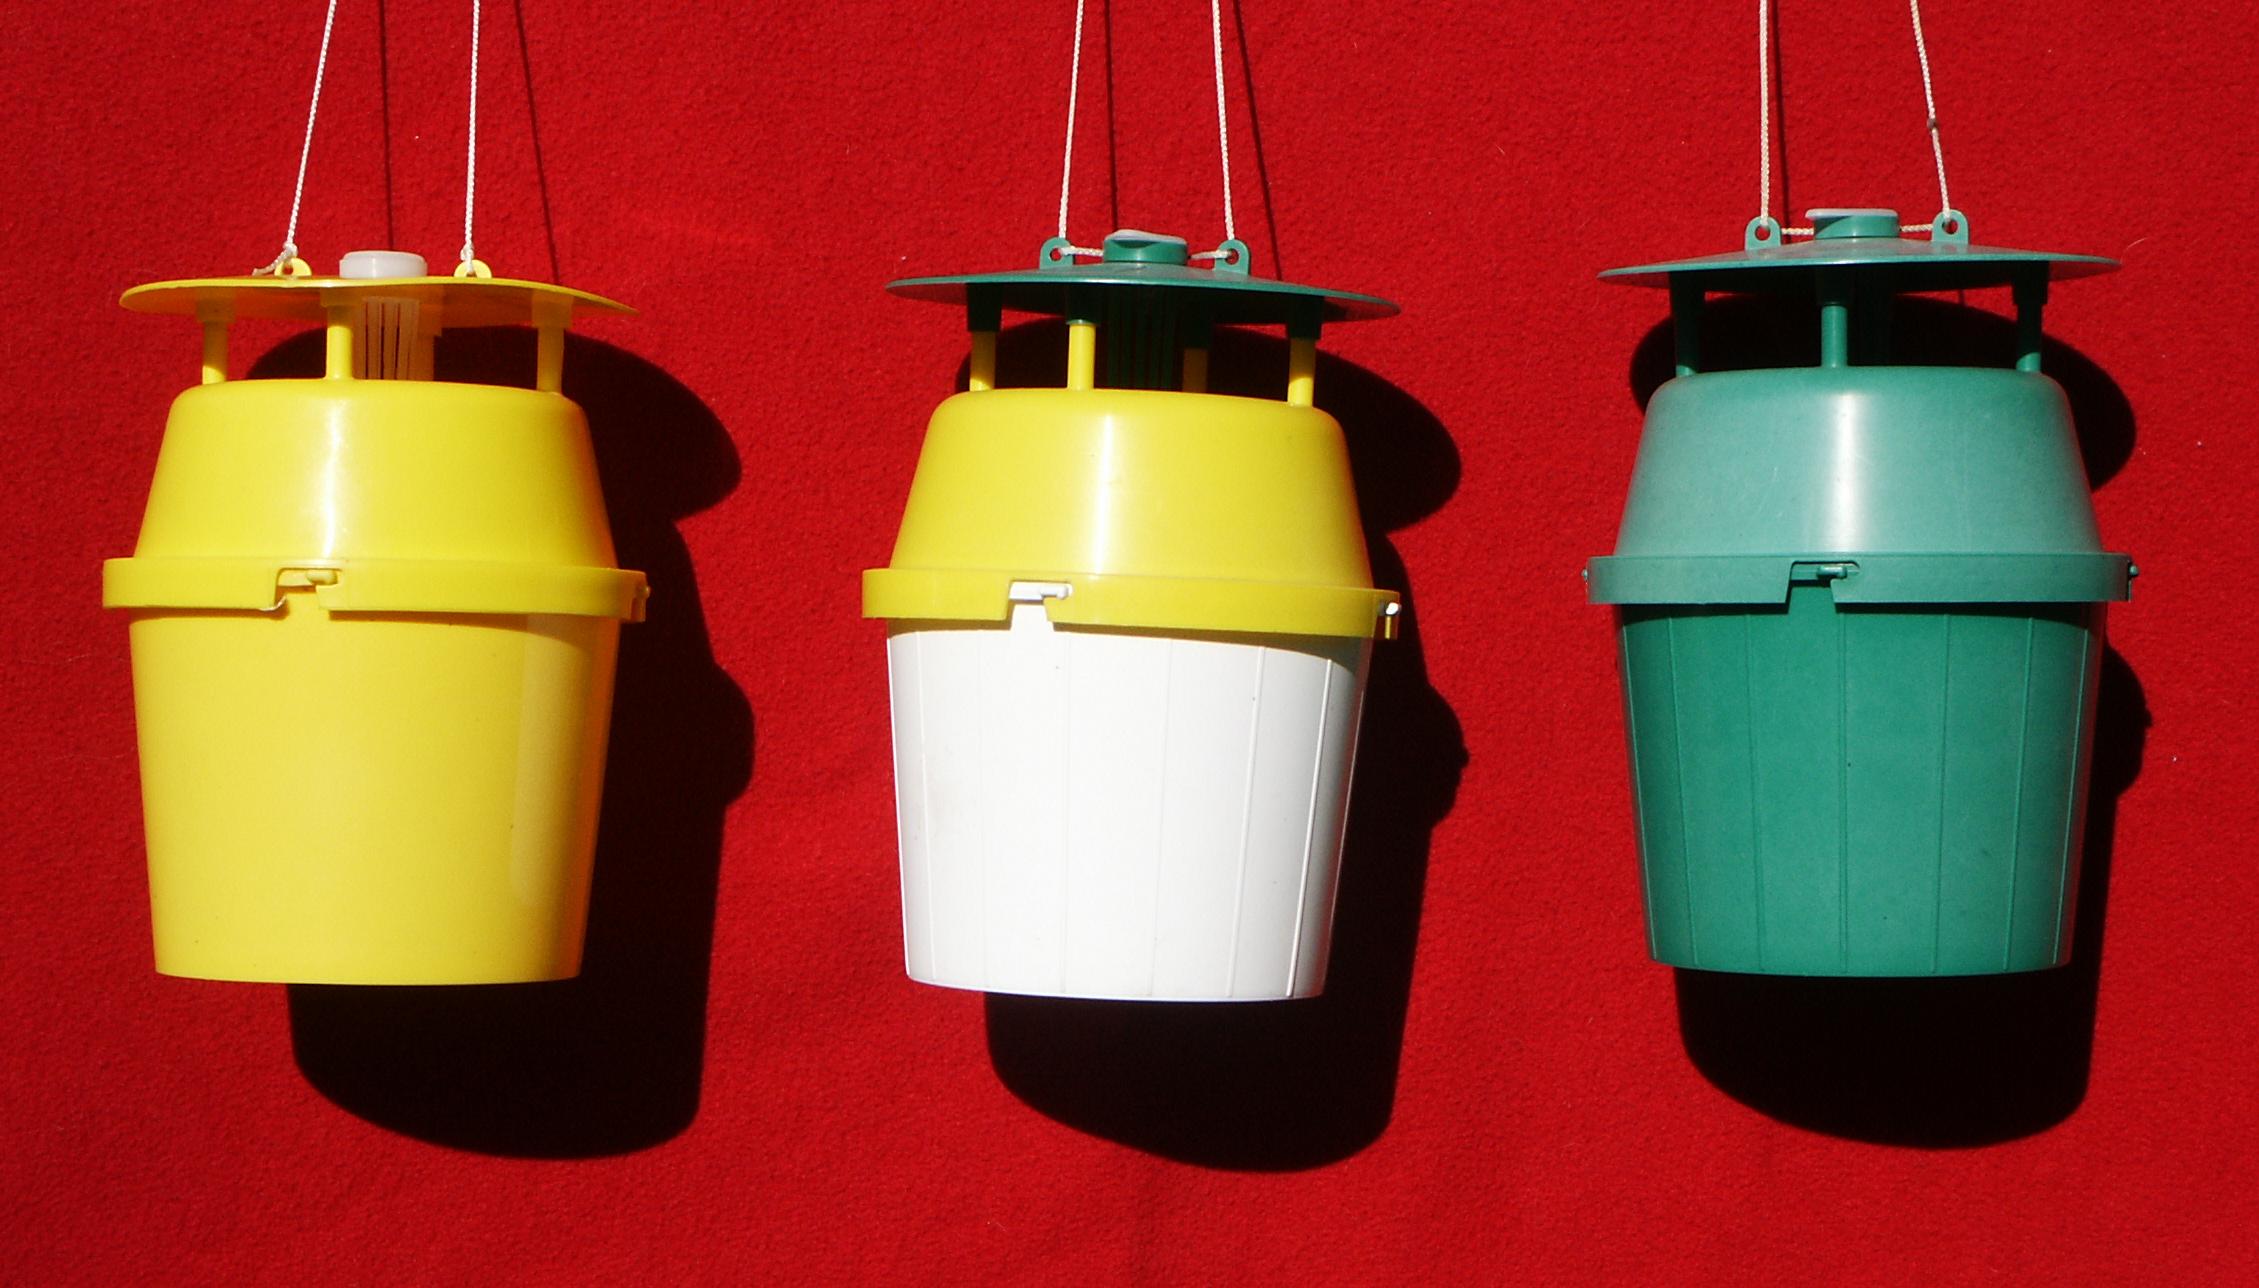
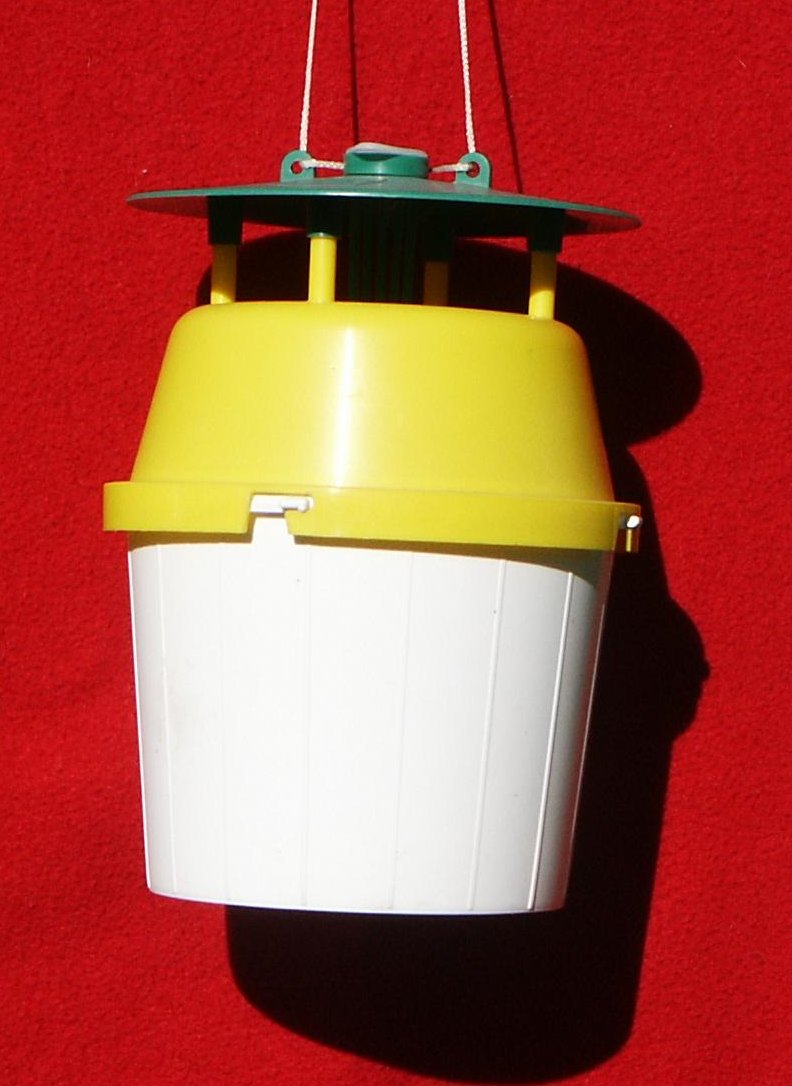
In 2002, two plastic universal moth bucket traps were utilized. One trap was totally green and the other trap had a green top, yellow midsection and white bucket and is known as a standard trap. The traps were placed fifteen feet apart in the center of the vineyard. A total of 150 moths were captured in the standard trap and 74 were caught in the green trap. An additional 15 were captured by hand or with a net for a total of 239 moths.
NE – SARE funded experiments 2003 – 2008
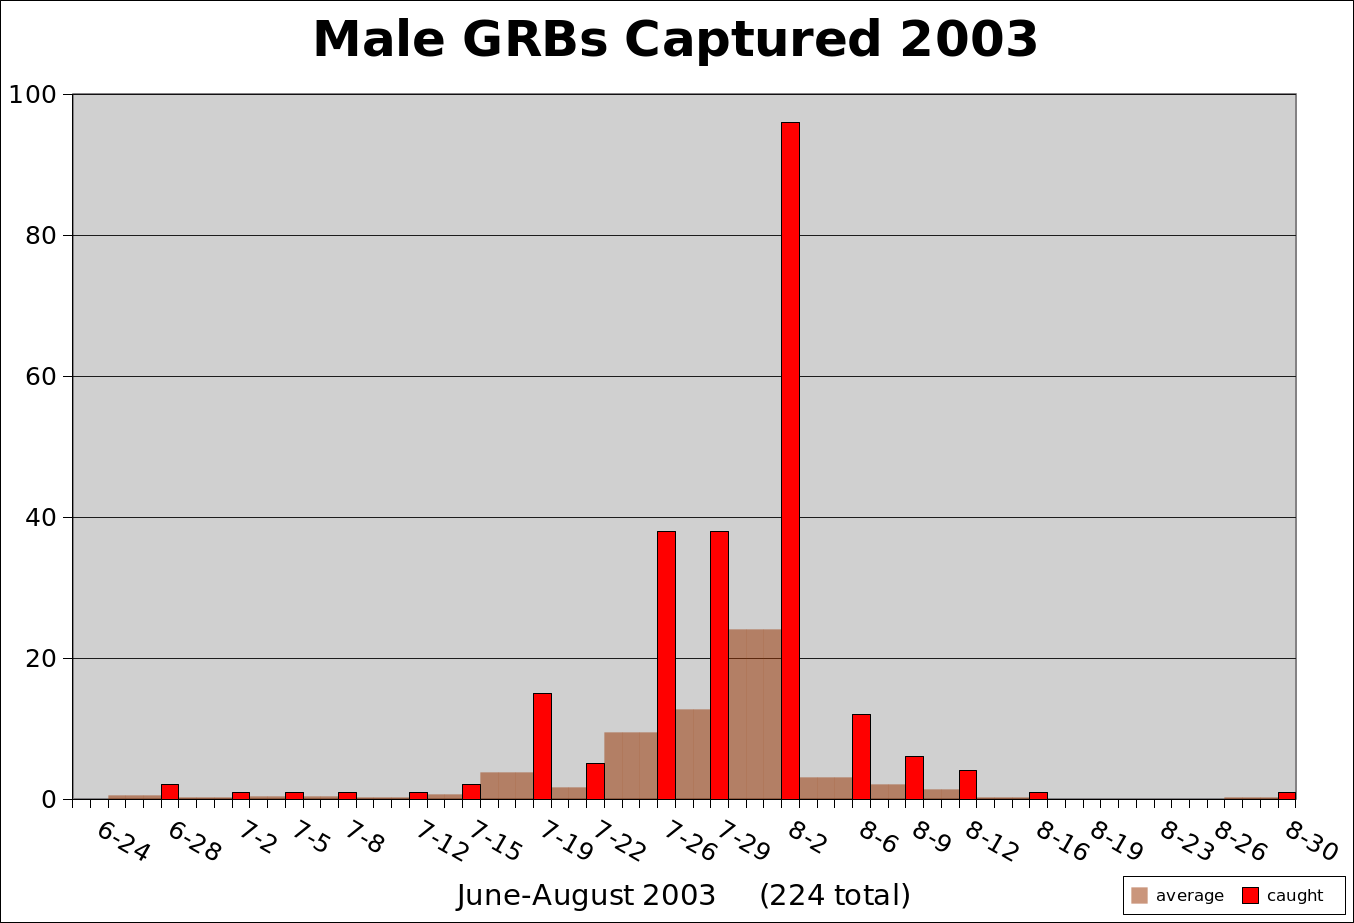
2003
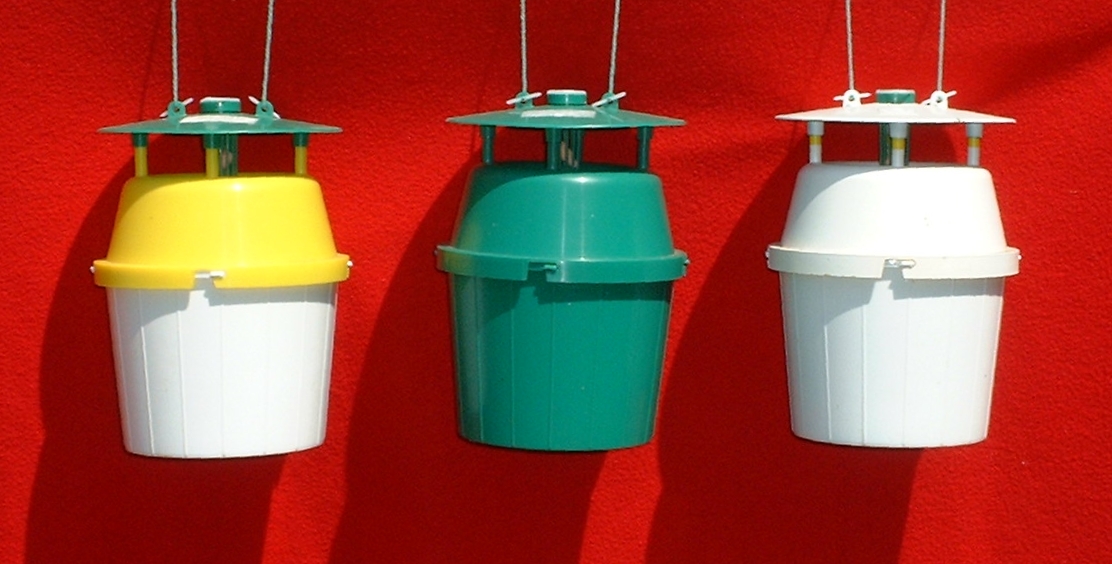
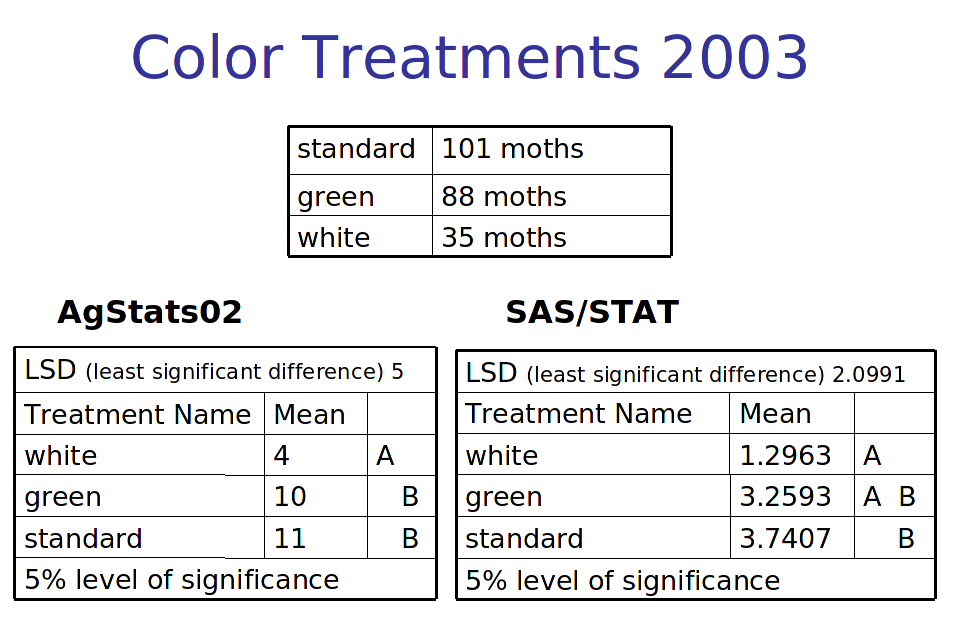
Beginning in 2003, much larger experiments were run to determine the best trap color or if the color was even important. The majority of the funding for these experiments was through NE – SARE. Three different colors of bucket traps were selected: green, white and the green/yellow/white combination called standard. A total of 81 traps were placed in the vineyard, 27 of each color. The vineyard was divided into 27 blocks of 72 feet by 54 feet or 3888 square feet. Each block was divided into three plots of 18 feet by 72 feet or 1296 square feet per plot. A trap was placed at the center of each plot. Each plot in a block received a different color.
Three different trap placements were also utilized in the test. Traps were placed at 18 inches above the ground or below the vine canopy, 44 inches above the ground or in the middle of the canopy close to the fruiting zone and 70 inches or at the top of the vine canopy. Each height had 27 replicates. For trap height the vineyard was divided into 9 blocks of 162 feet by 72 feet or 11,664 square feet. Each block was divided into three plots of 72 feet by 54 feet or 3,888 square feet. Within each block the three traps were placed at the same height. There were 27 replicates for each height.
A randomized complete block design was used for each variable and covered 85.1% of the vineyard. The height and color of the traps in each plot was selected using a ten thousand random digit table. Every trap contained a grape root borer pheromone lure.
Statistical analysis was performed on the results using an analysis of variance with AgStats02 and an analysis of variance and Tukey’s studentized range test with SAS/STAT. No statistical significance was found between the different heights with any of the statistical programs. The color treatments were statistically significant. With the AgStats program the standard and green traps were significantly better than the white traps at a 5% level and with the SAS/STAT program the standard was better than the white at a 5% level.
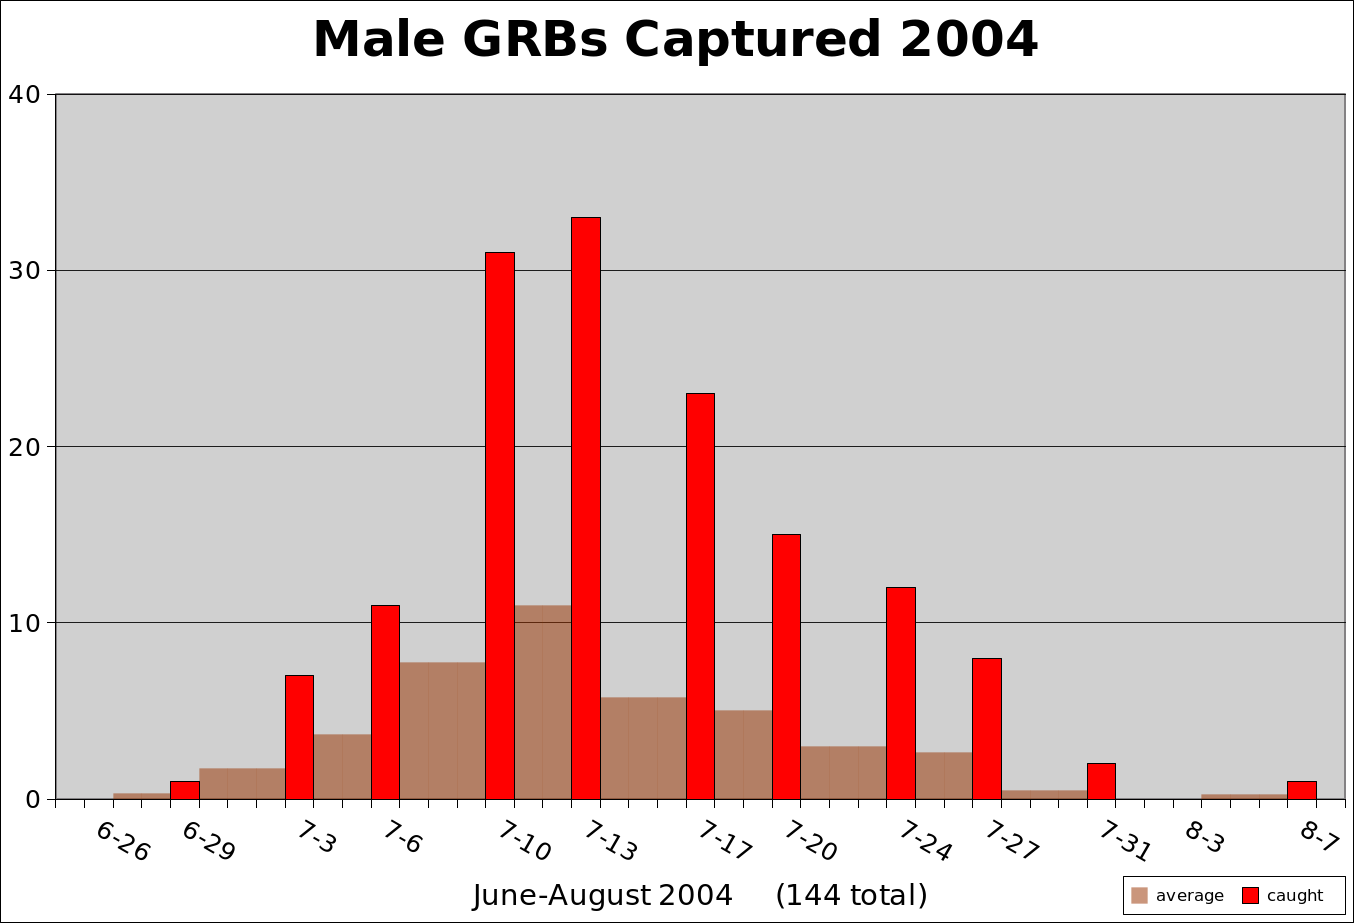
2004
In 2004 the same experimental design was used to check and validate the previous results and to also ascertain if mating disruption is possible with a high number of pheromone traps. Utilizing high numbers of pheromone traps is also known as mass trapping. Although the same plots and blocks were utilized, the trap color and height placement in each plot was randomly reselected with a ten thousand random digit table.
The results in 2004 mirrored those obtained in 2003. The same statistical programs were used. With both the AgStats02 and SAS/STAT Tukey’s studentized range test the standard (green/yellow/white) traps were significantly better than the green and white traps at a 5% level of significance. No statistical significance was found between the three height placements with Tukey’s studentized range test at a 5% level.

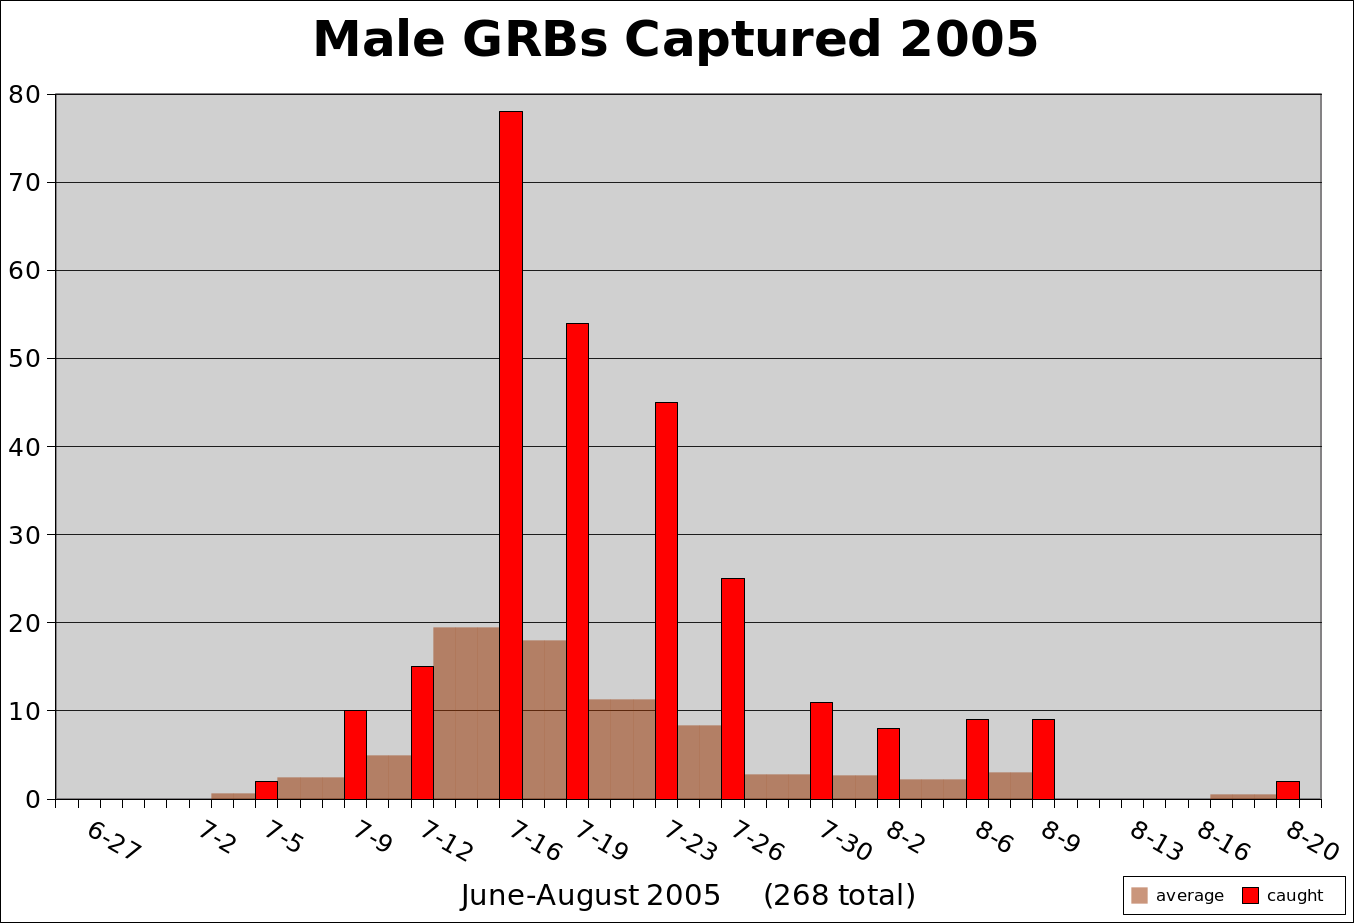
2005
The all white traps captured fewer moths in both 2003 and 2004 and the results were statistically significant. In 2005 the white traps were removed from the experiment and replaced with all yellow traps. As before, the same plots and blocks were utilized, the trap color and height placement in each plot was randomly reselected with a ten thousand random digit table.
With the removal of the white traps, no statistical significance was found between the various colors of traps with either AgStats02 or the Tukey’s studentized range test. The height placements now became statistically significant. The high (70”) and medium (44”) placements were significantly better than the low (18”) placement with the AgStats02 program at a 5% level of significance. With the Tukey’s studentized range test, the high placement was better than the low placement at a 5% level of significance.

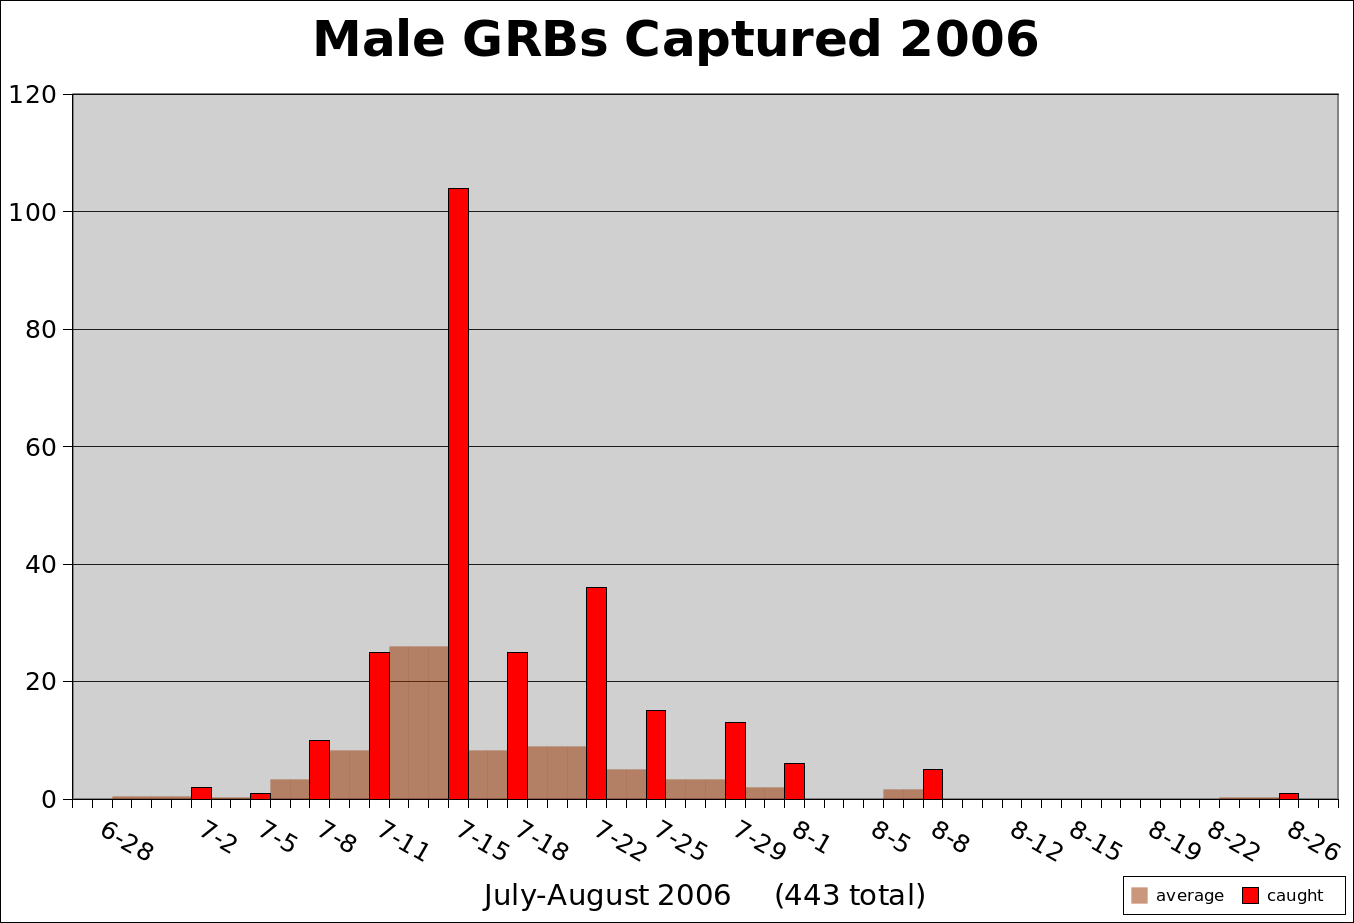
2006
In 2006 the same colors (yellow, green and standard) and height placement (70, 44 and 18 inches) of the traps were utilized. The same experimental design, randomized complete block design, was repeated. Although the same plots and blocks were utilized, the trap color and height placement in each plot was randomly reselected with a ten thousand random digit table.
The results in 2006 mirrored those obtained in 2005 and confirmed the results that placement of the traps can be significant. Only the AgStats02 statistical program was used in 2006. The SAS/STAT statistical programs were not available. High (70”) and medium (44”) trap placement were significantly better than the low (18”) placement at a 5% level of significance. No statistical significance was found between the three trap colors.

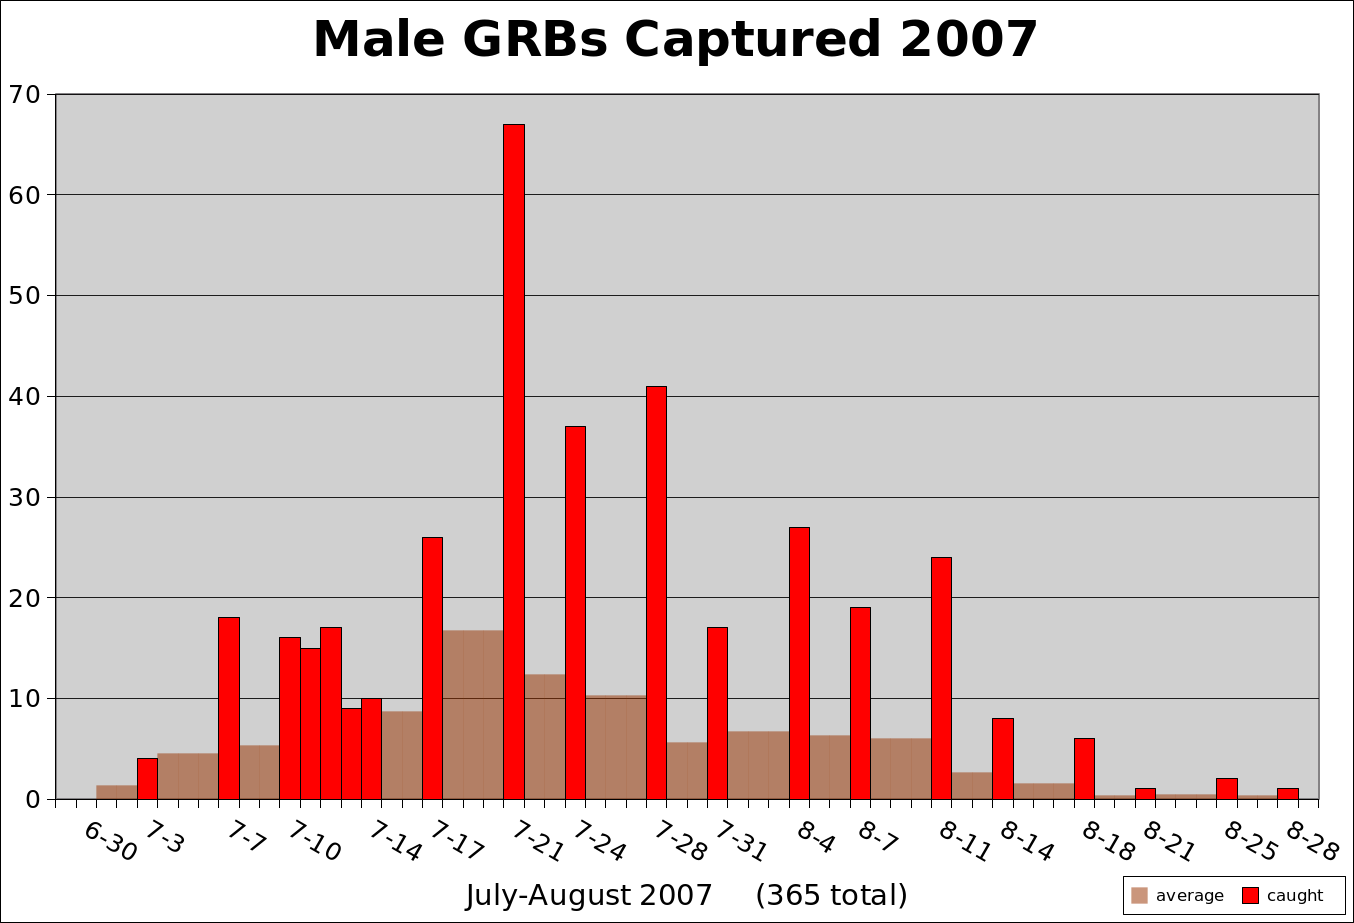
2007
In both 2005 and 2006 the trap placement was statistically significant. Each year the low (18”) placement captured the fewest moths. Depending on the statistical program used it was less efficient than the high and medium placement or just the high placement at a 5% level of significance. Because of the statistical significance, the height placements were modified in 2007. The high placement remained at 70” and the former medium placement of 44” now became the low placement. The new medium (57”) placement was mid-way between the low and high. The same color of traps (yellow, green and standard) were repeated in 2007 that had been used in 2005 and 2006. The same randomized complete block design was repeated as in previous years. Although the same plots and blocks were utilized, the trap color and height placement in each plot was randomly reselected with a ten thousand random digit table.
Two different statistical programs, AgStats02 and Tukey’s studentized range test, were used in 2007. With both programs the medium(57”) placement was significantly better than the high (70”) placement at a 5% level of significance. No statistical significance was found between the three trap colors.

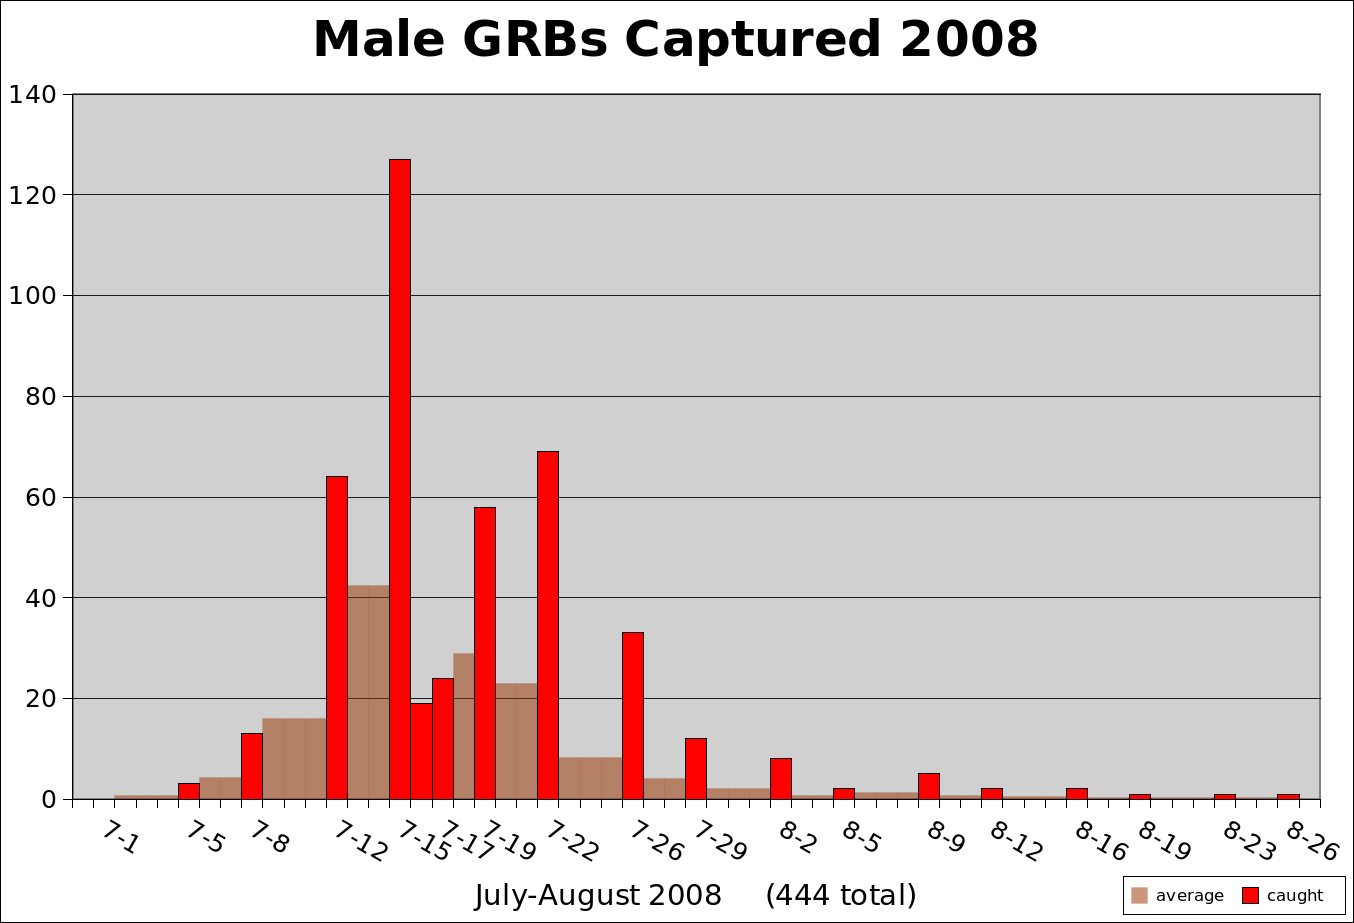
2008
In 2008 the same colors (yellow, green and standard) and height placements (70, 57 and 44 inches) used in 2007 were repeated. The same experimental design, randomized complete block, was utilized. Although the same plots and blocks were used, the trap color and height placement in each plot was randomly reselected with a ten thousand random digit table.
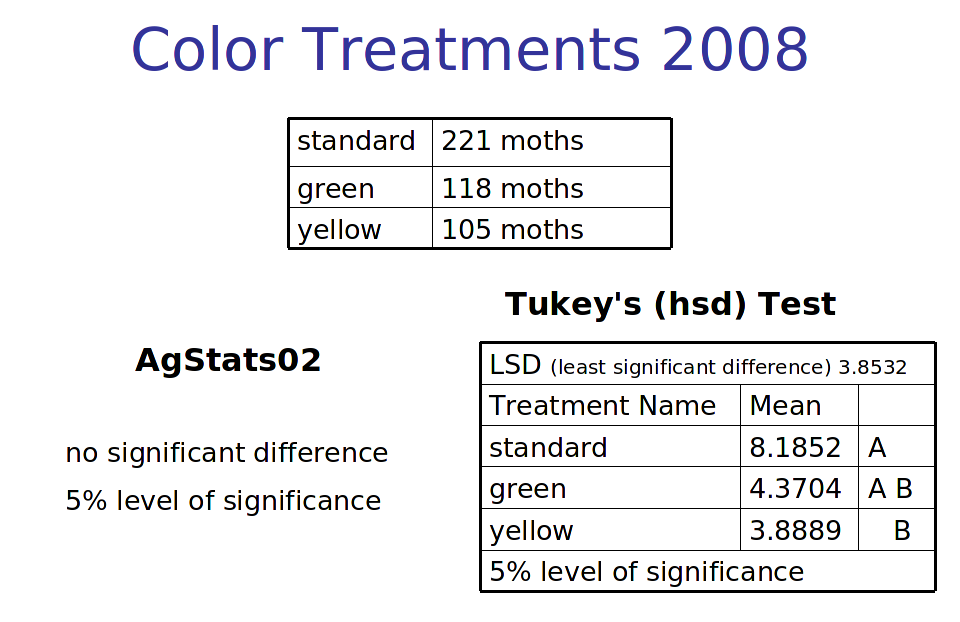
The same statistical programs, AgStats02 and Tukey’s studentized range test, used in 2007 were used in 2008. Although the same heights and colors were repeated, the results differed from 2007. No statistical significance was found between the three heights with either program. In 2008, the trap color was statistically significant. With the Tukey’s studentized range test, the standard color traps captured significantly more moths than the all yellow traps at a 5% level of significance. No significance was found with AgStats02 program.
Conclusions
In both 2003 and 2004, the white traps captured significantly fewer moths than the other traps. This result calls into question the use of white paperboard traps or any white trap for an estimation of grape root borer populations. Once the white traps were removed, the color of the trap was rarely significant and the placement of the trap became important. The low placement traps (pheromone lure 18” above the ground) caught significantly fewer moths in 2005 and 2006. With changing one set of traps from 18 inches above the ground to 57 inches, the height placement became less important.
Pheromone traps utilized for grape root borer should not be white and should be placed about 48 to 70 inches above the ground. The use of 33 pheromone traps per acre did not reduce the number of male grape root borers captured over six years. The total number captured actually increased during that time period. It cannot be determined if the traps helped to keep the population from being even greater.
2009 Landey Vineyards funded experiment
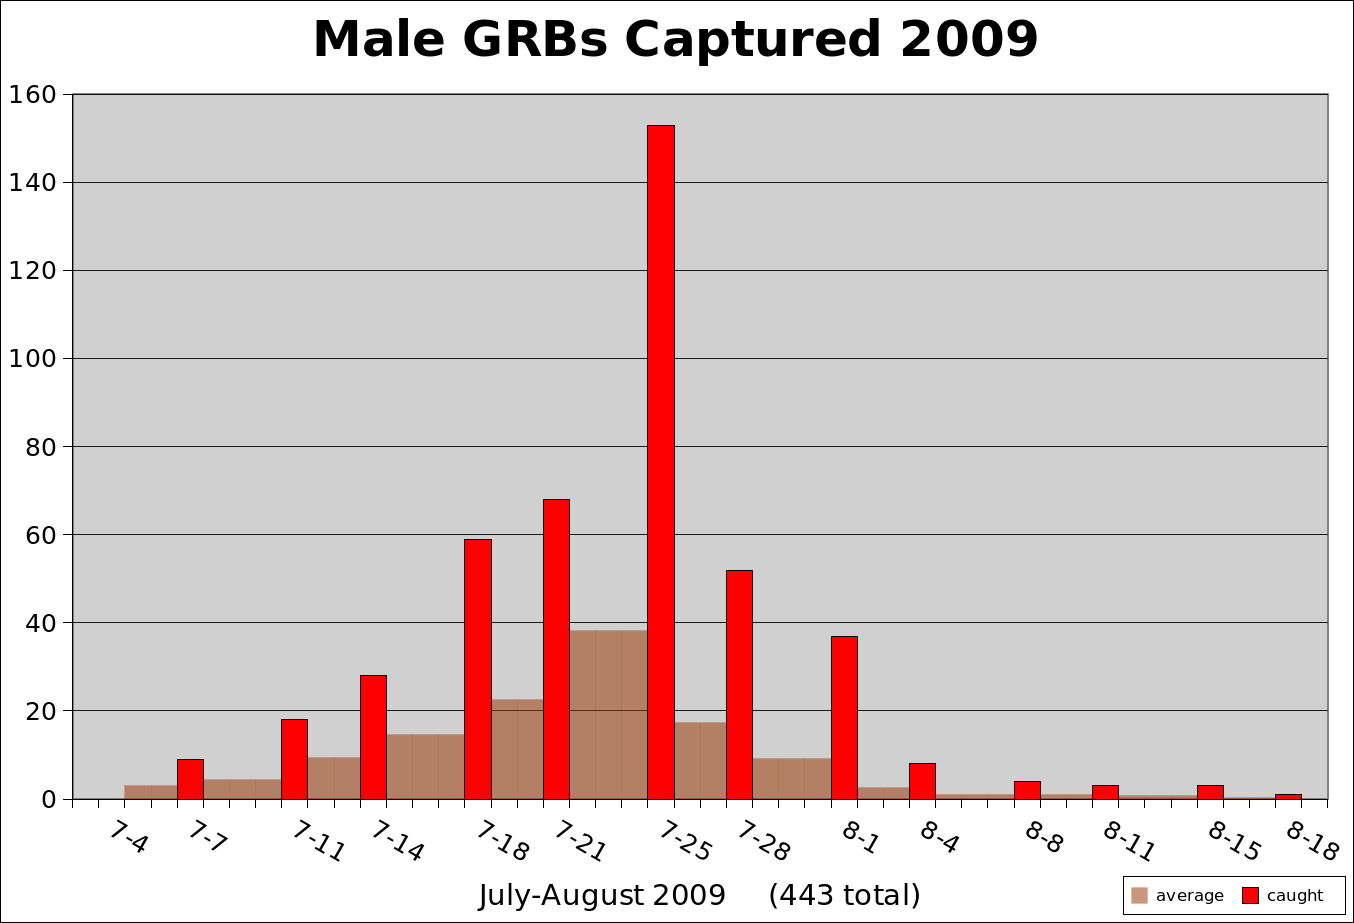
In 2009 an experiment was run to determine if increased numbers of pheromone lures could modify the capture of male grape root borers. Three different amounts of lures were selected for the traps: one, two, or four lures per trap. A total of 27 traps of the standard (green/yellow/white) color combination were placed in the vineyard at a height of approximately 66 inches. A randomized complete block design was used for the study and covered 85.1% of the vineyard. The vineyard was divided into 9 blocks of 72 feet by 162 feet or 11664 square feet. Each block was divided into three plots of 54 feet by 72 feet or 3888 square feet per plot. Each plot in this study was the same as a block in the previous experiments. A trap was placed at the center of each plot. The number of pheromone lures in each trap was selected using a ten thousand random digit table. Each plot in a block received a different number of pheromone lures. There were 9 replicates for each variable.
Statistical analysis was performed on the results using a one-way analysis of variance (ANOVA) on vassarstats.net. No statistical significance was found between the three different amounts of pheromone lures.
Jubb Jr., G. R. 1982. Occurrence of the grape root borer, Vitacea polistiformis, in Pennsylvania. Melsheimer Entomol. Ser. 32: 20-24.↩︎